Best Candlestick Patterns for Quotex 2026 | Beginner Trading Strategy Guide
Quotex candlestick charts are one of the most important tools for getting a feel of market movements and, honestly, making better trading decisions. I mean, these candles show traders what kind of price trends are forming, how strong the momentum looks, and where a reversal might start right in the moment. Every single candlestick shows the opening price, the closing price, the highest price, and the lowest price for whatever timeframe you choose, so it becomes simpler to read what the market is doing.
Beginners and also more experienced traders often use candle formations on Quotex to sharpen their accuracy and to build workable trading strategies. When you study common bullish candle patterns and bearish candle patterns, you can make more realistic guesses about how prices may move next, and that can improve your odds of closing successful trades on the Quotex trading platform.
What Are Candlestick Patterns?
Candlestick patterns are one of the most important tools used by traders on Quotex to predict market direction. These patterns appear on trading charts and help traders understand whether buyers or sellers are controlling the market.
Each candlestick shows four main price points:
By analyzing candlestick formations, traders can identify trend reversals, continuation trends, and possible entry points. Candlestick analysis is popular because it works on forex, crypto, commodities, and indices.
Why Candle Patterns Matter in Quotex
Candlesticks help traders.
- Find accurate entry points
- Detect trend reversals
- Improve short-term trading decisions
- Understand market psychology
- Combine signals with indicators
Many successful traders use candlestick analysis together with RSI, MACD, and moving averages for better accuracy.
Best Candlestick Patterns for Quotex Trading
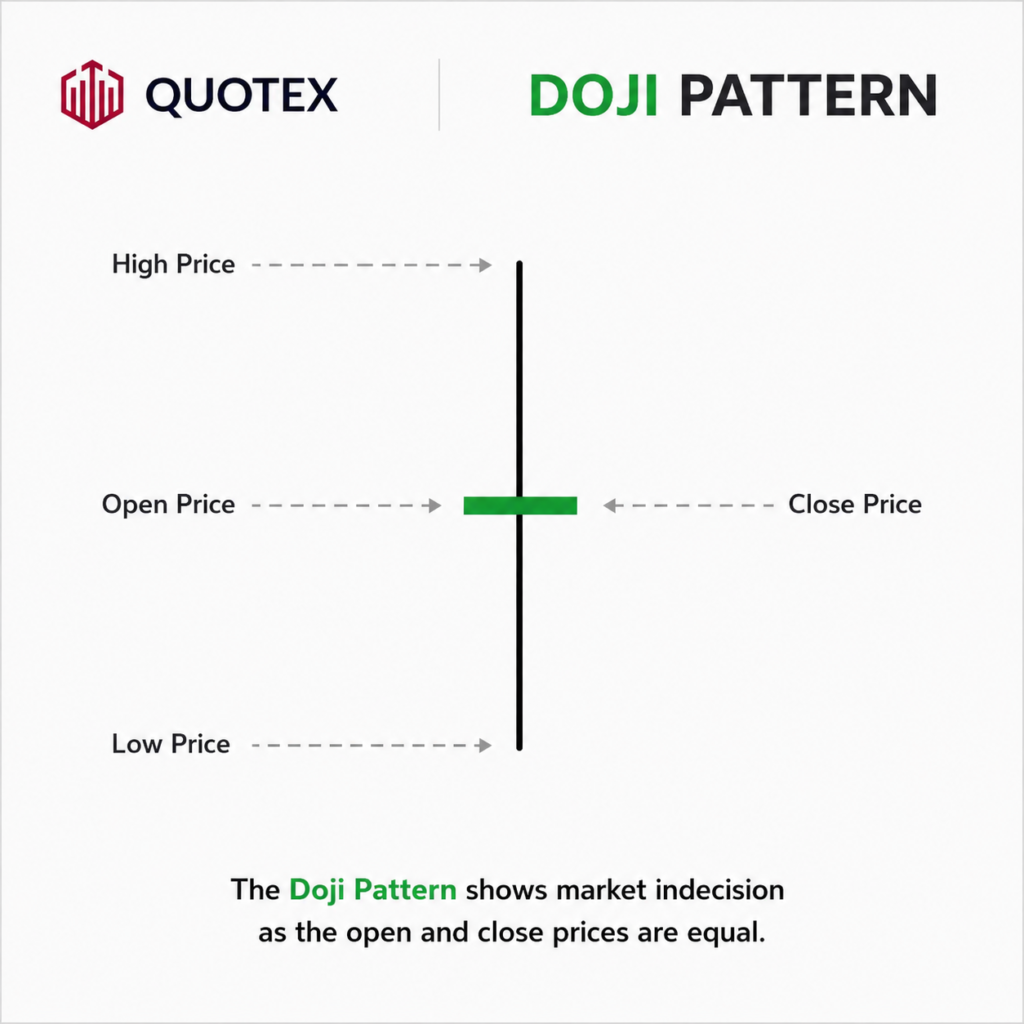
1. Doji Pattern
The Doji pattern forms when the opening and closing prices are nearly equal. It shows market indecision and often appears before a trend reversal.
Best Use:
- Reversal trading
- Trend exhaustion
- Support and resistance zones
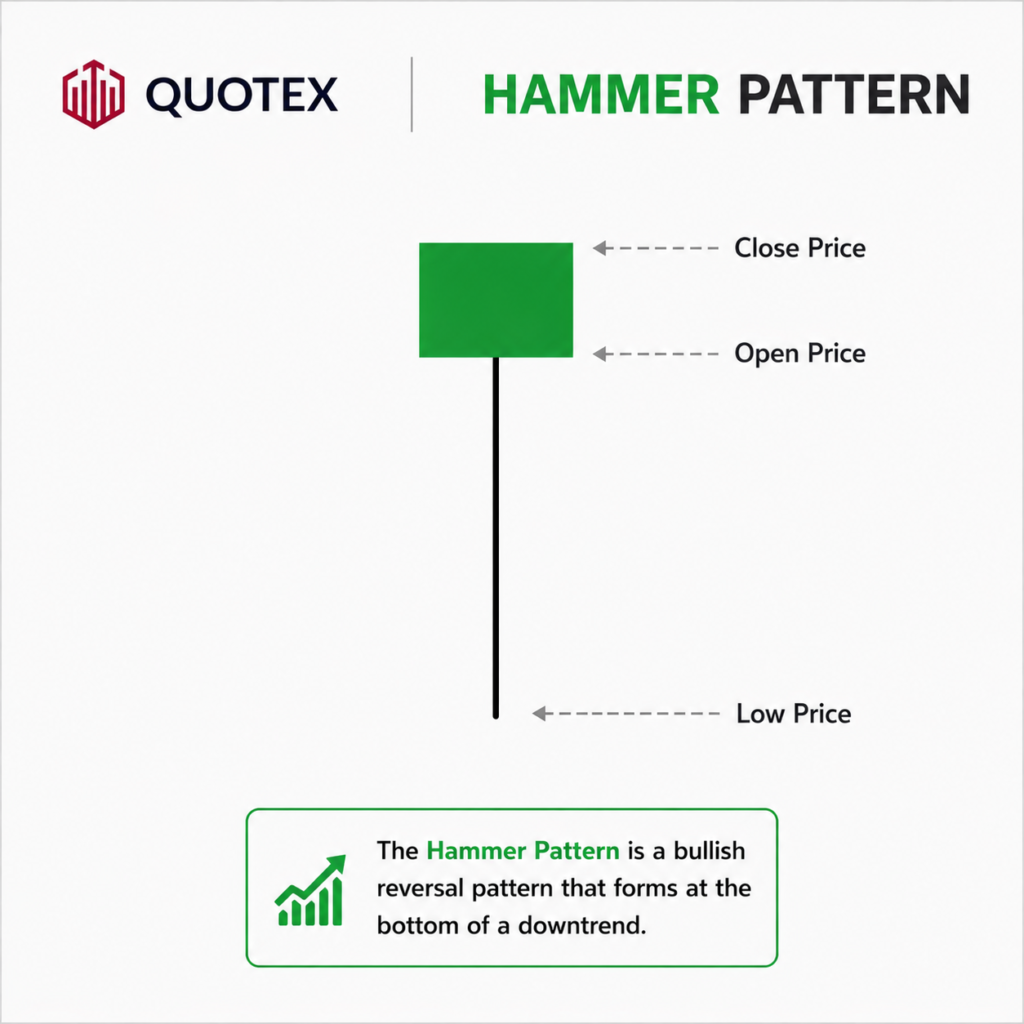
Hammer Candlestick Pattern
The hammer appears after a downtrend and signals a possible bullish reversal. It has a small body with a long lower wick.
Why Traders Use It:
- Detects buying pressure
- Shows weak sellers
- Useful for short-term trading
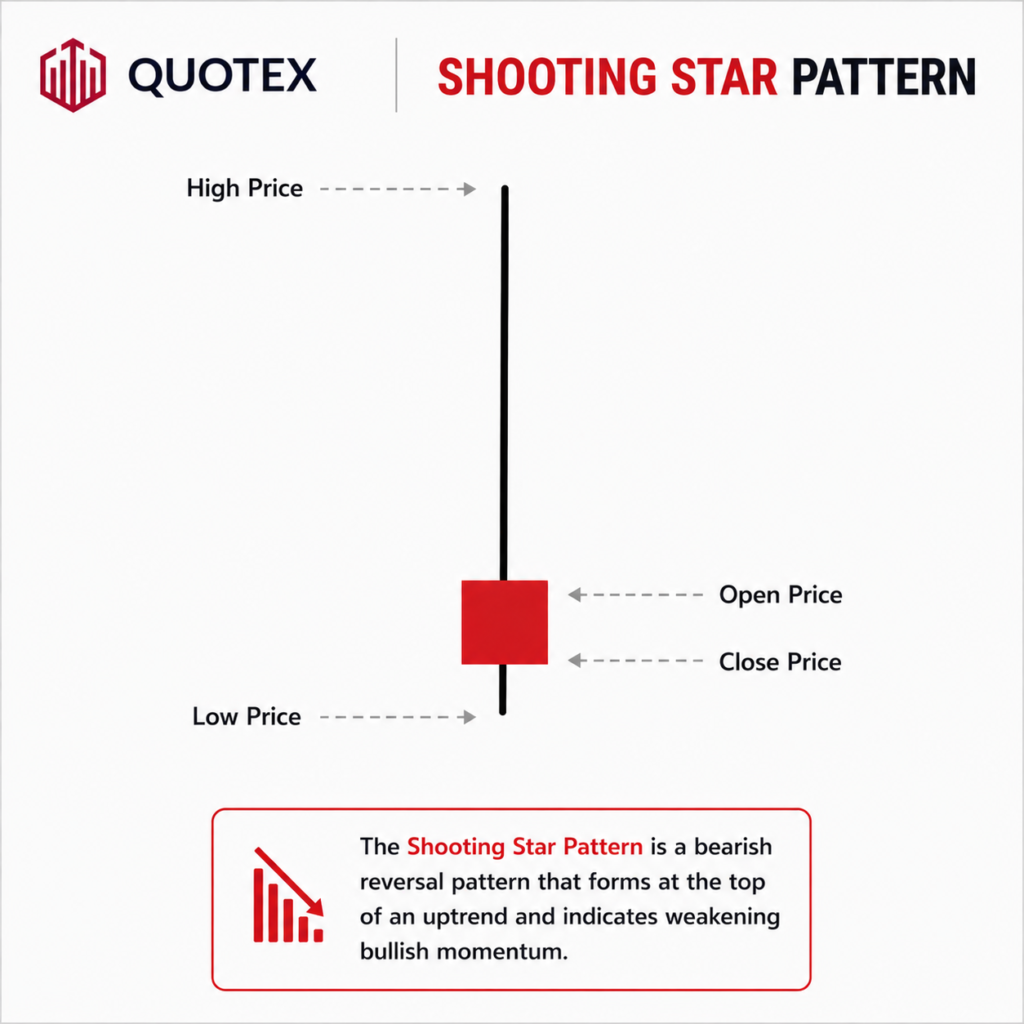
Shooting Star Pattern
The Shooting Star appears after an uptrend and signals bearish reversal potential. It has a long upper shadow and small body.
Best Conditions:
- Strong resistance zones
- Overbought market
- Weak buying momentum
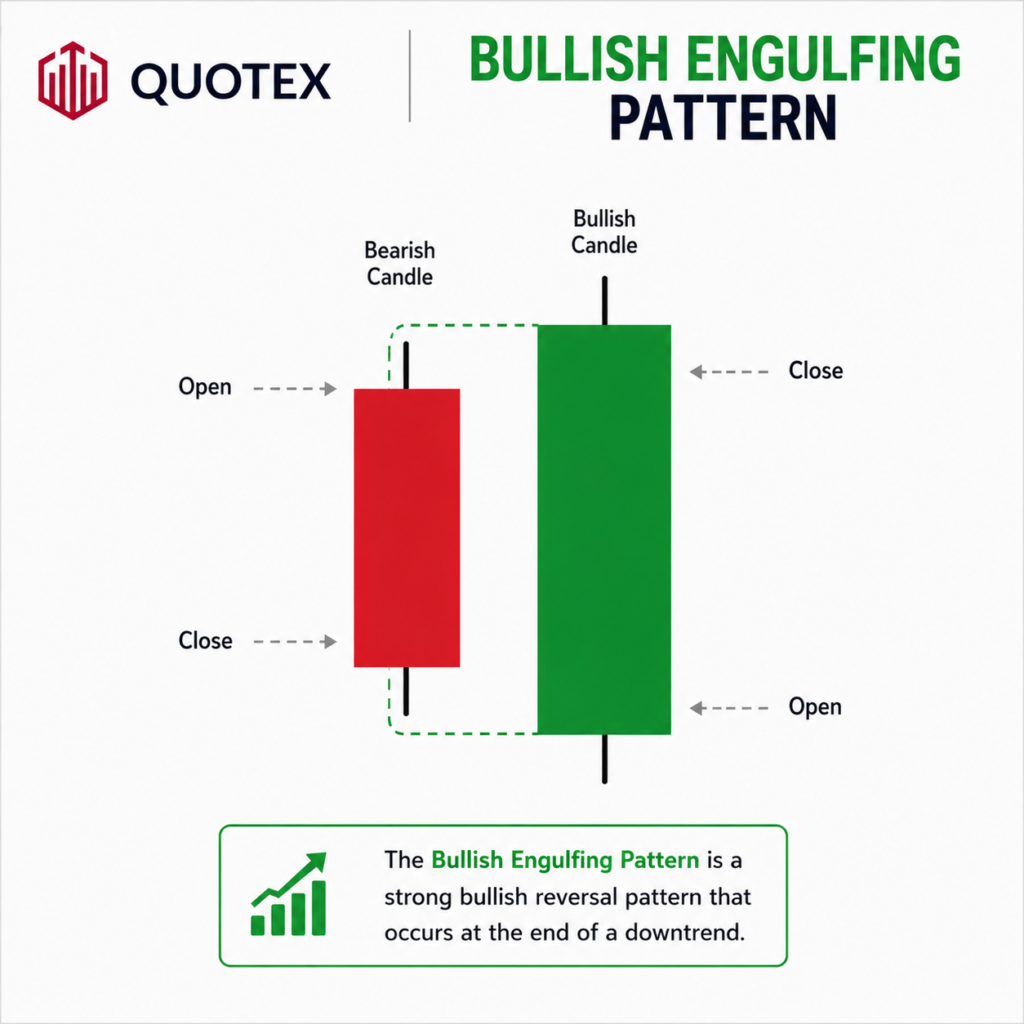
Bullish Engulfing Pattern
This pattern occurs when a large bullish candle completely covers the previous bearish candle. It suggests strong buying momentum.
Why It Works:
- Confirms bullish reversal
- Indicates buyer strength
- Common in forex and crypto markets
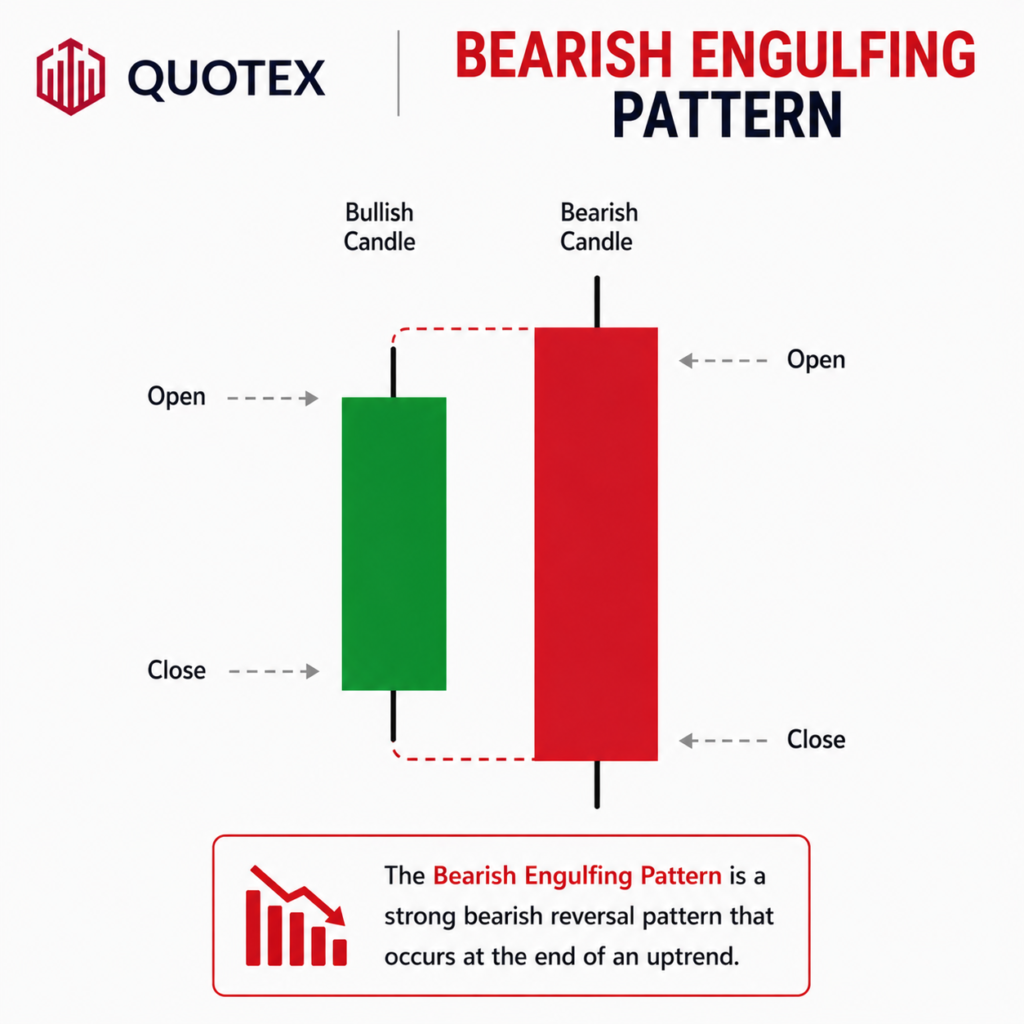
Bearish Engulfing Pattern
A bearish engulfing pattern forms when a large bearish candle fully covers the previous bullish candle. It often signals downward movement.
Traders Use It For:
- Selling opportunities
- Trend reversals
- Confirmation entries
How to Use Candlestick Patterns Successfully
To improve accuracy on Quotex:
- Combine candlestick patterns with indicators
- Trade with the trend
- Avoid emotional trading
- Use support and resistance levels
- Practice on demo accounts first
Candlestick patterns work best when combined with proper market analysis.
Importance of Candlestick Confirmation in Trading
Candlestick confirmation is, like one of the biggest ideas in trading on Quotex because it kinda helps traders dodge false market entries. A lot of beginners jump into a position just because they see one lone candle; meanwhile, the more experienced traders will wait for the next candle to basically “confirm” what they think is happening. That small delay really boosts the accuracy of Quotex trading signals, and it also makes it easier to spot stronger market momentum. If you learn these confirmation techniques, you will strengthen your Quotex price action strategy overall, and you also lower the number of risky trades you take.
Multi-Candlestick Analysis for Better Market Prediction
Multi-candlestick analysis is basically about looking at a bunch of candles together, not just staring at one lone pattern, and yeah, it can feel a bit repetitive at first. Traders use this approach to catch how strong a trend really is, where a market might flip back around, or whether price is likely to keep going in the same direction.
In Candlestick Trading for Beginners, learning to read several candles at once makes it easier to spot more convincing bullish and bearish patterns while at the same time filtering out the weak or noisy signals that don’t really hold up. A lot of professional traders also blend this idea with the best candlestick patterns for Quotex so they can craft more advanced trading setups and honestly sharpen their chart-reading skills faster.
Conclusion
Candlestick patterns are one of the most valuable tools for traders using Quotex because they sort of help notice market direction, reversals, and potential trading windows with better accuracy. If you learn how to read candlestick charts, you can make trading choices more smoothly, and beginners often understand market psychology a bit clearer, even if it feels kind of noisy at first. People commonly watch patterns like doji, hammer, shooting star, bullish engulfing, and bearish engulfing in technical analysis and price action trading. And when you pair those signals with extra indicators, plus solid risk management, candlestick strategies can give traders a stronger foundation, more confidence, and more disciplined habits, which usually matters for long-term success.